High-Resolution Antibody Kinetics and Epitope Characterization
Surface plasmon resonance (SPR) technology is a mainstay for measuring antibody-antigen binding kinetics, affinity ranking, and determining epitope recognition.
Our cutting-edge, high-throughput SPR technology, powered by multiple Carterra LSA platforms, enables screening of thousands of antibody affinities and binning up to 192 x 192 interactions for precise affinity and epitope binding analysis. Coupled with our clonal gene synthesis, automated expression platform, developability, and functional characterization, Twist Biopharma Solutions can generate a data package that enables you to identify and make the most informed decisions about your therapeutic candidates.
Affinity Ranking Used to Select Robust, Functional Antibodies
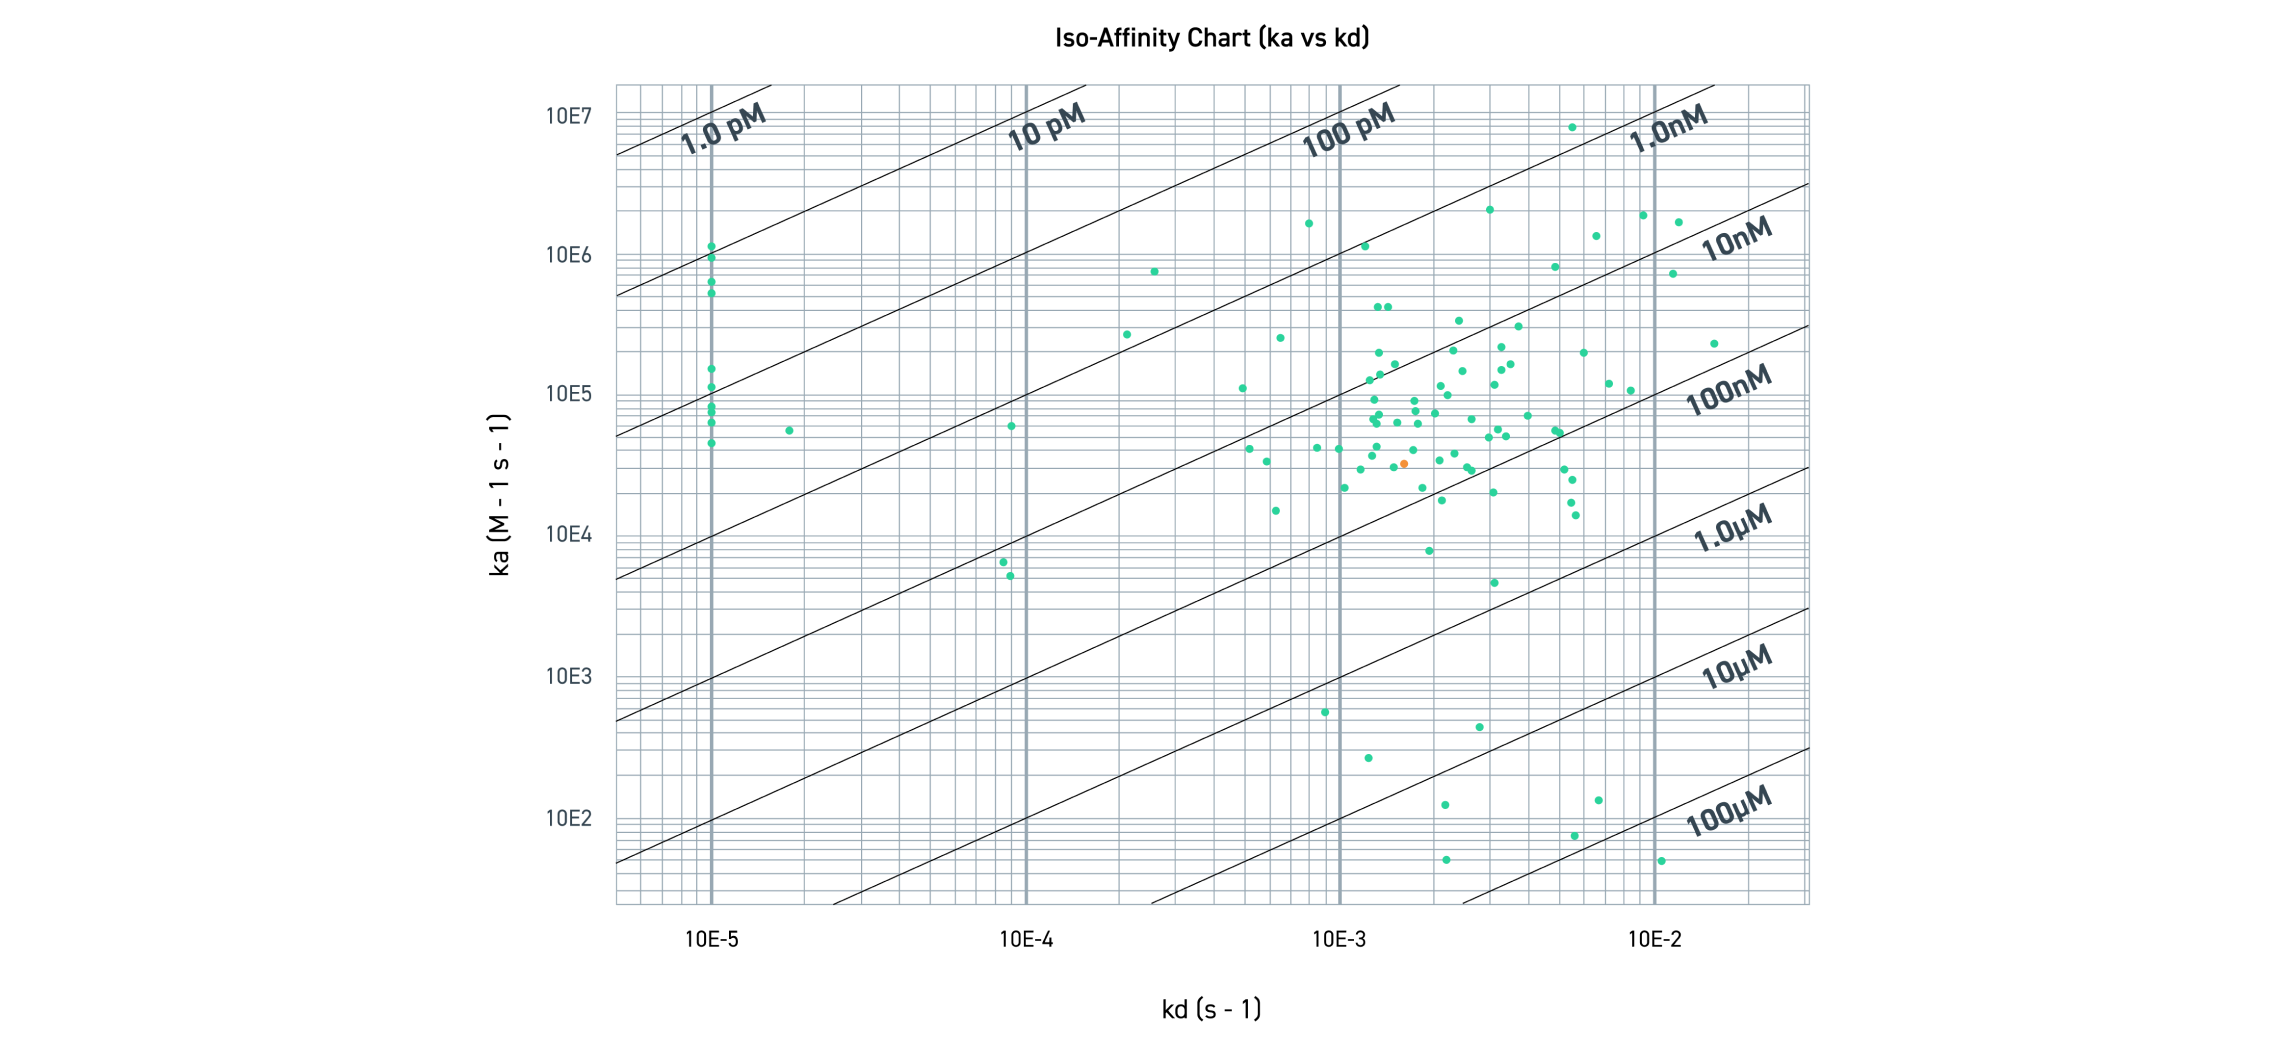
The figure shows the distribution of antibody affinity in the context of on-rate (ka) and off rate (kd). The y-axis represents the on-rate (ka), in which the antibody binds to the antigen. ka depends on antigen concentration (M) and time (seconds). The x-axis represents the off-rate (kd), in which the antibody dissociates from the antigen. kd is dependent upon time (seconds). KD is a ratio of kd/ka, representing apparent affinity in molarity — as such, a smaller KD value represents higher affinity. The location of the red dots represents the ka and kd of each antibody. The red dots are grouped into their respective KD ranges.
High-Resolution Antibody Kinetics and Epitope Characterization
Surface plasmon resonance (SPR) technology is a mainstay for measuring antibody-antigen binding kinetics, affinity ranking, and determining epitope recognition.
Our cutting-edge, high-throughput SPR technology, powered by multiple Carterra LSA platforms, enables screening of thousands of antibody affinities and binning up to 192 x 192 interactions for precise affinity and epitope binding analysis. Coupled with our clonal gene synthesis, automated expression platform, developability, and functional characterization, Twist Biopharma Solutions can generate a data package that enables you to identify and make the most informed decisions about your therapeutic candidates.
Affinity Ranking Used to Select Robust, Functional Antibodies

The figure shows the distribution of antibody affinity in the context of on-rate (ka) and off rate (kd). The y-axis represents the on-rate (ka), in which the antibody binds to the antigen. ka depends on antigen concentration (M) and time (seconds). The x-axis represents the off-rate (kd), in which the antibody dissociates from the antigen. kd is dependent upon time (seconds). KD is a ratio of kd/ka, representing apparent affinity in molarity — as such, a smaller KD value represents higher affinity. The location of the red dots represents the ka and kd of each antibody. The red dots are grouped into their respective KD ranges.
Affinity Ranking Used to Select Robust, Functional Antibodies
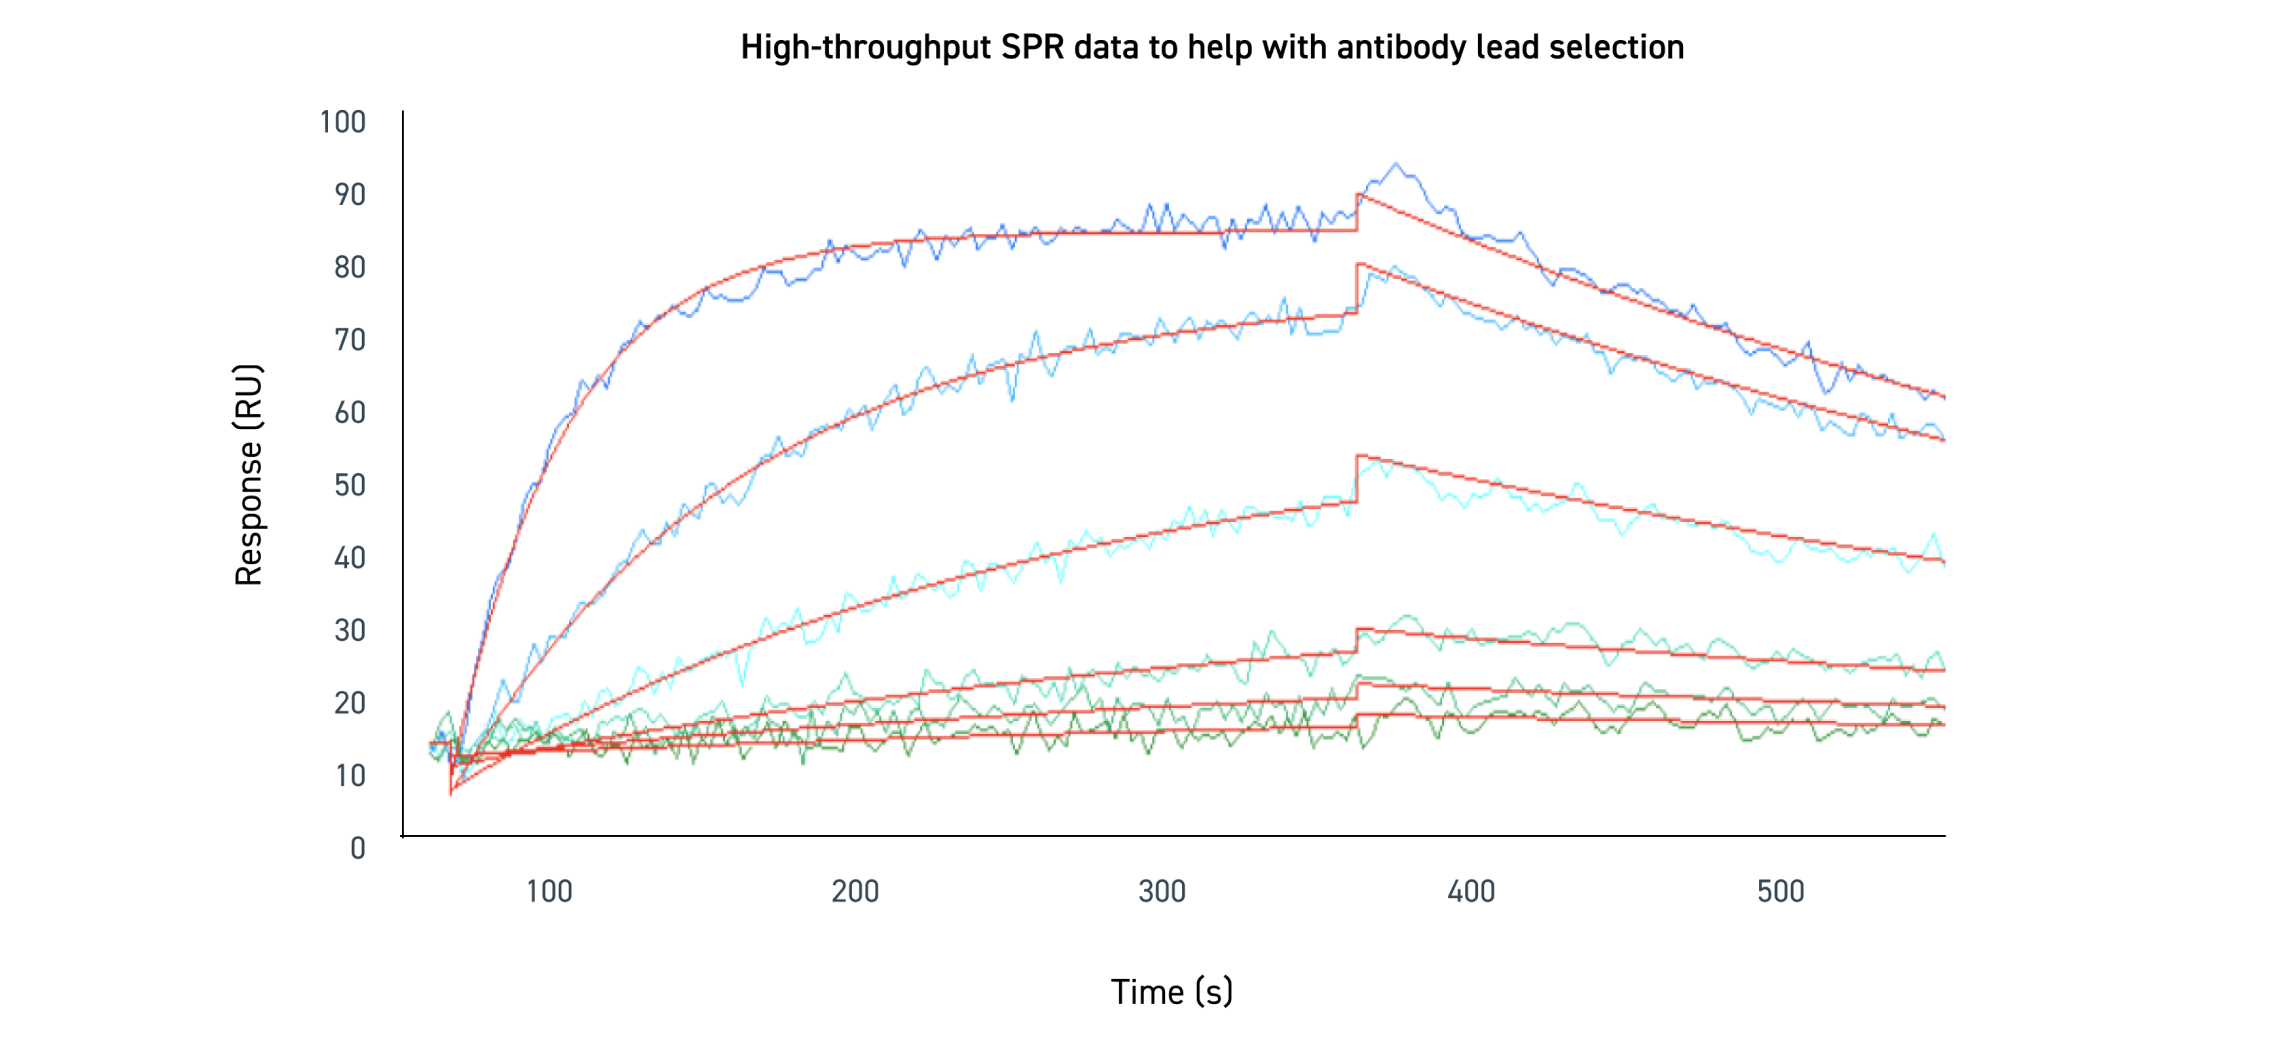
Binding was measured at various concentrations and globally fit to estimate the KD. The lines on the sensorgram trend upwards during the association phase, in which the antibody binds to the target antigen. The lines trend downwards during the dissociation phase, as the antibody eventually falls off the antigen over the course of time. The various shades of blue lines represent the varying concentrations of target protein. The lines that exhibit a higher RU are associated with higher antigen concentration. The red lines represent the global fit of the data.
Affinity Ranking Used to Select Robust, Functional Antibodies

Binding was measured at various concentrations and globally fit to estimate the KD. The lines on the sensorgram trend upwards during the association phase, in which the antibody binds to the target antigen. The lines trend downwards during the dissociation phase, as the antibody eventually falls off the antigen over the course of time. The various shades of blue lines represent the varying concentrations of target protein. The lines that exhibit a higher RU are associated with higher antigen concentration. The red lines represent the global fit of the data.
Technical Resources
Technical Resources
Get in Touch With Us
Antibody enthusiasts are standing by and would love to hear more about your discovery needs. Challenging targets welcome!
