Cinétique des anticorps à haute résolution et caractérisation des épitopes
La technologie de la résonance plasmonique de surface (SPR) est un pilier de la mesure de la cinétique de liaison anticorps-antigène, du classement par affinité et de la détermination de la reconnaissance des épitopes.
Notre technologie SPR de pointe à haut débit, qui s’appuie sur plusieurs plates-formes LSA Carterra, permet de cribler des milliers d’affinités d’anticorps et de regrouper jusqu’à 192 x 192 interactions pour une analyse précise de l’affinité et de la liaison des épitopes. Grâce à sa synthèse de gènes clonaux, à sa plateforme d’expression automatisée, à sa capacité de développement et à sa caractérisation fonctionnelle, Twist Biopharma Solutions peut générer un ensemble de données qui vous permettra d’identifier vos candidats thérapeutiques et de prendre les décisions les plus éclairées à leur sujet.
Classement par affinité pour sélectionner des anticorps robustes et fonctionnels
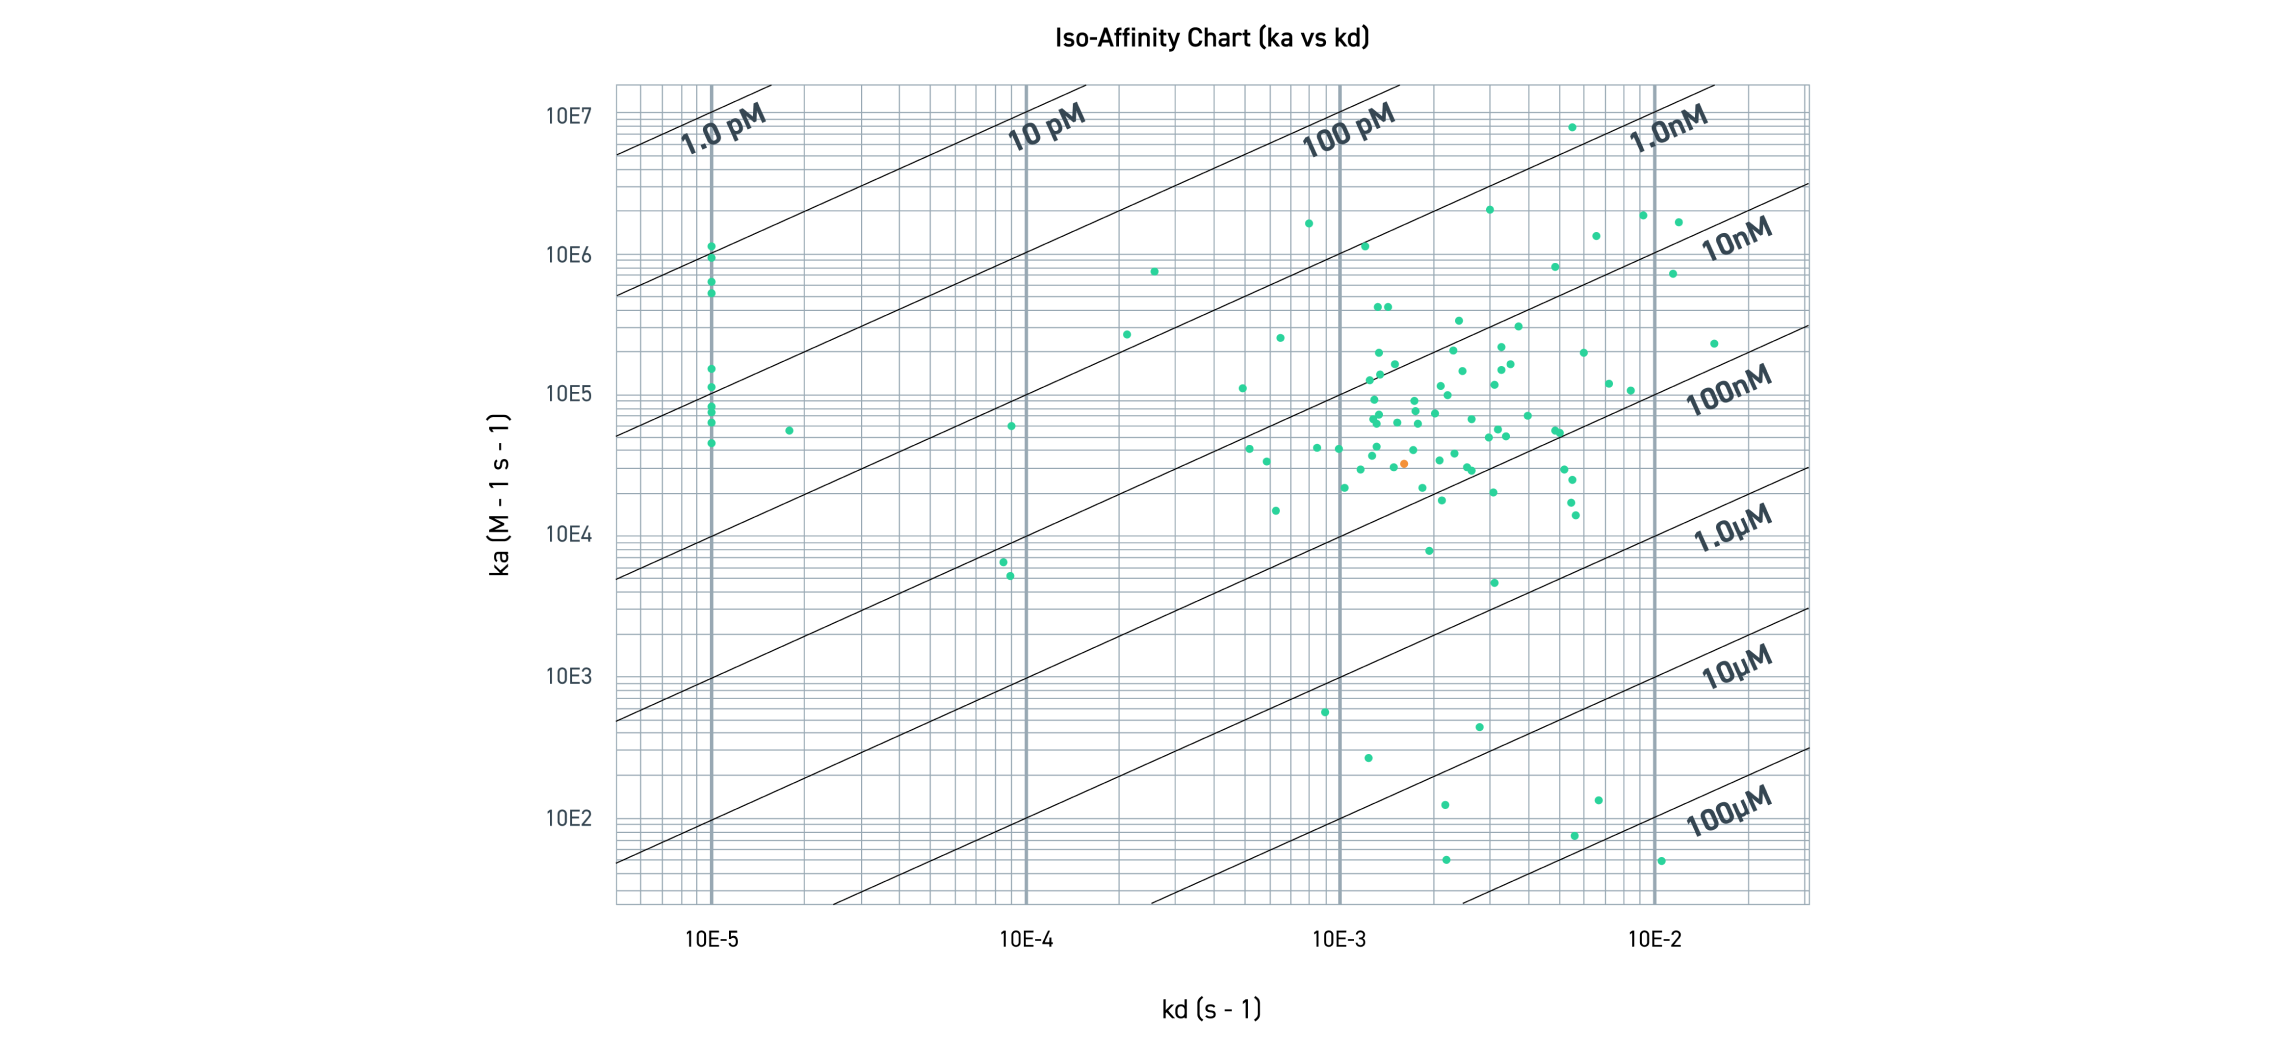
La figure présente la distribution de l’affinité des anticorps par rapport au taux d’association (ka) et au taux de dissociation (kd). L’axe des y représente le taux d’association (ka), à savoir la liaison de l’anticorps à l’antigène. ka est fonction de la concentration en antigène (M) et du temps (secondes). L’axe des x représente le taux de dissociation (kd), à savoir la dissociation de l’anticorps et de l’antigène. kd est fonction du temps (secondes). KD est le rapport kd/ka. Il représente l’affinité apparente exprimée en molarité : par conséquent, une valeur KD plus petite représente une affinité plus élevée. L’emplacement des points rouges représente les valeurs ka et kd de chaque anticorps. Les points rouges sont regroupés dans leurs plages KD respectives.
Cinétique des anticorps à haute résolution et caractérisation des épitopes
La technologie de la résonance plasmonique de surface (SPR) est un pilier de la mesure de la cinétique de liaison anticorps-antigène, du classement par affinité et de la détermination de la reconnaissance des épitopes.
Notre technologie SPR de pointe à haut débit, qui s’appuie sur plusieurs plates-formes LSA Carterra, permet de cribler des milliers d’affinités d’anticorps et de regrouper jusqu’à 192 x 192 interactions pour une analyse précise de l’affinité et de la liaison des épitopes. Grâce à sa synthèse de gènes clonaux, à sa plateforme d’expression automatisée, à sa capacité de développement et à sa caractérisation fonctionnelle, Twist Biopharma Solutions peut générer un ensemble de données qui vous permettra d’identifier vos candidats thérapeutiques et de prendre les décisions les plus éclairées à leur sujet.
Classement par affinité pour sélectionner des anticorps robustes et fonctionnels

La figure présente la distribution de l’affinité des anticorps par rapport au taux d’association (ka) et au taux de dissociation (kd). L’axe des y représente le taux d’association (ka), à savoir la liaison de l’anticorps à l’antigène. ka est fonction de la concentration en antigène (M) et du temps (secondes). L’axe des x représente le taux de dissociation (kd), à savoir la dissociation de l’anticorps et de l’antigène. kd est fonction du temps (secondes). KD est le rapport kd/ka. Il représente l’affinité apparente exprimée en molarité : par conséquent, une valeur KD plus petite représente une affinité plus élevée. L’emplacement des points rouges représente les valeurs ka et kd de chaque anticorps. Les points rouges sont regroupés dans leurs plages KD respectives.
Classement par affinité pour sélectionner des anticorps robustes et fonctionnels
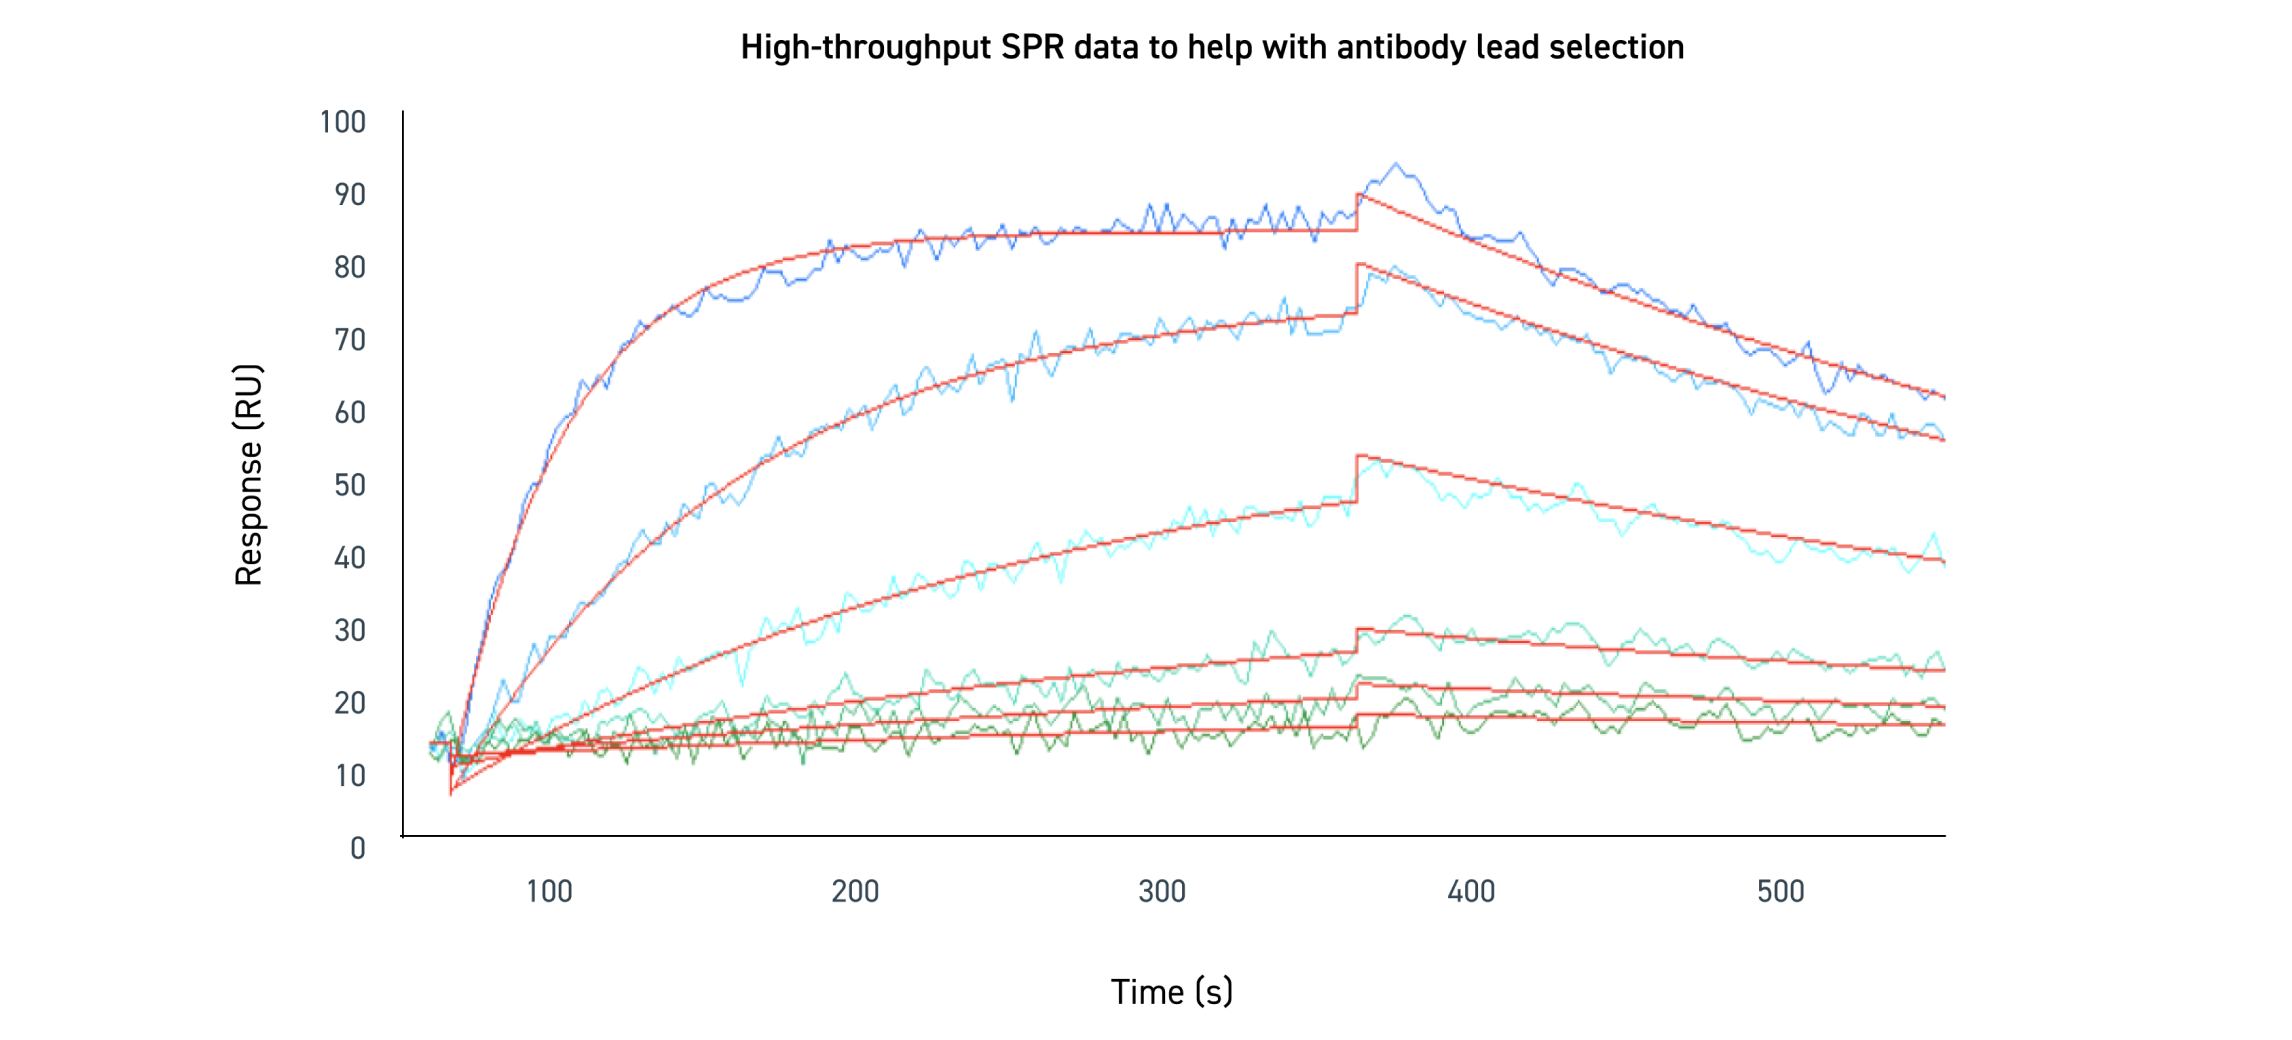
La liaison a été mesurée à des concentrations diverses et ajustée dans l’ensemble pour estimer le KD. Les lignes du sensorgramme tendent vers le haut pendant la phase d’association, au cours de laquelle l’anticorps se lie à l’antigène cible. Les lignes tendent vers le bas pendant la phase de dissociation, car l’anticorps finit par se séparer de l’antigène dans le temps. Les différentes nuances de lignes bleues représentent les différentes concentrations de la protéine cible. Les lignes qui présentent une RU plus élevée sont associées à une plus forte concentration d’antigènes. Les lignes rouges représentent l’ajustement global des données.
Classement par affinité pour sélectionner des anticorps robustes et fonctionnels

La liaison a été mesurée à des concentrations diverses et ajustée dans l’ensemble pour estimer le KD. Les lignes du sensorgramme tendent vers le haut pendant la phase d’association, au cours de laquelle l’anticorps se lie à l’antigène cible. Les lignes tendent vers le bas pendant la phase de dissociation, car l’anticorps finit par se séparer de l’antigène dans le temps. Les différentes nuances de lignes bleues représentent les différentes concentrations de la protéine cible. Les lignes qui présentent une RU plus élevée sont associées à une plus forte concentration d’antigènes. Les lignes rouges représentent l’ajustement global des données.
Ressources techniques
Ressources techniques
Contactez-nous
Nos experts en anticorps se tiennent à votre disposition et aimeraient en savoir plus sur vos besoins en matière de recherche. Les cibles difficiles sont les bienvenues !
