Cinética de anticuerpos de alta resolución y caracterización de epítopos
La tecnología de resonancia de plasmón de superficie (SPR) es un soporte para medir la cinética de unión anticuerpo-antígeno, clasificación de la afinidad y determinación del reconocimiento de epítopos.
Nuestra innovadora tecnología SPR de alto rendimiento, basada en varias plataformas Carterra LSA, permite el cribado de miles de afinidades de anticuerpos y el agrupamiento de hasta 192 x 192 interacciones para la afinidad precisa y el análisis de unión de epítopos. Junto con la síntesis de genes de genes clonales, la plataforma de expresión automatizada, la capacidad de desarrollo y la caracterización funcional, Twist Biopharma Solutions puede generar un paquete de datos que le permite identificar y tomar las decisiones más informadas sobre candidatos terapéuticos.
Clasificación de afinidad usada para seleccionar anticuerpos robustos y funcionales
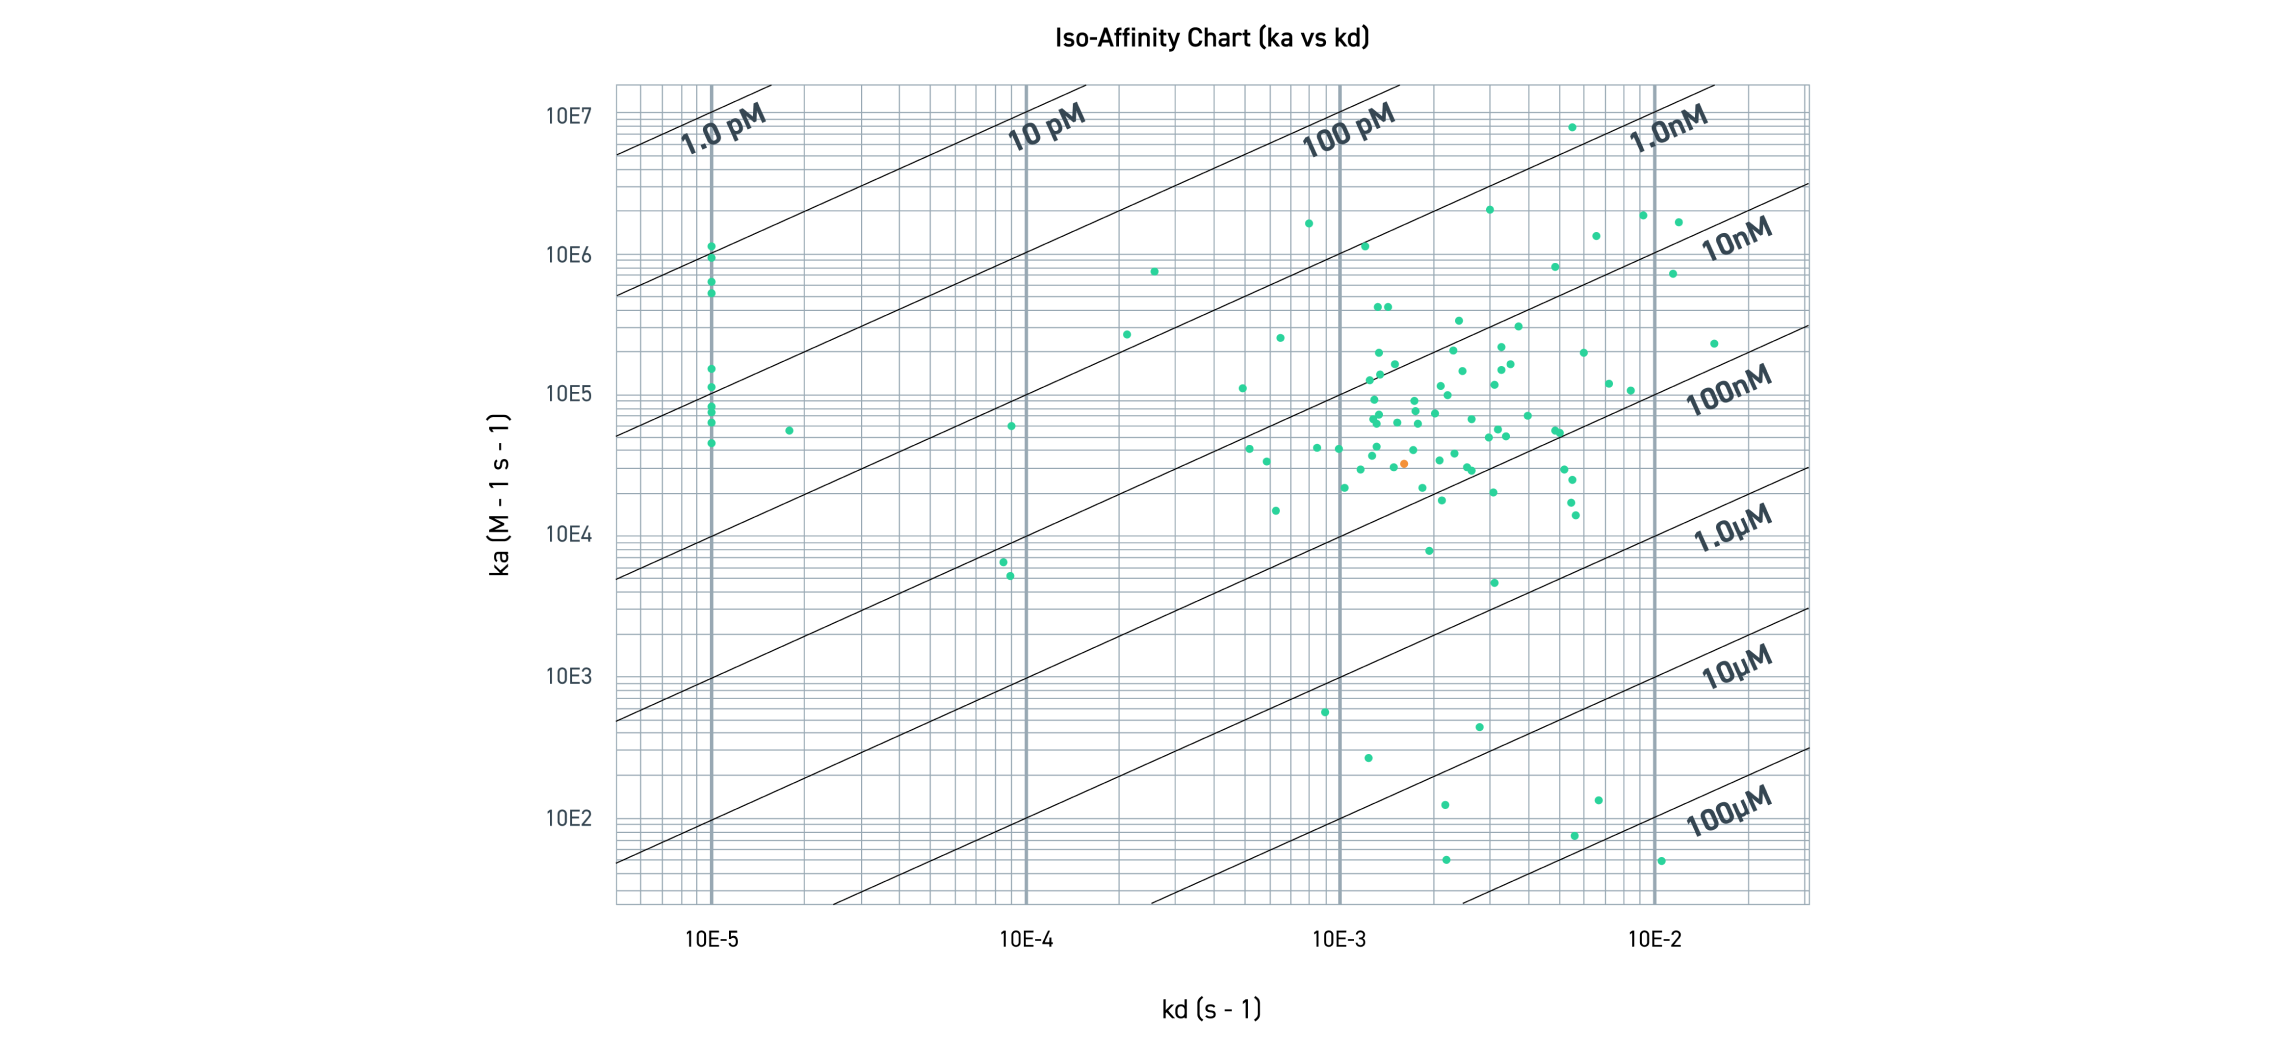
La ilustración muestra la distribución de la afinidad del anticuerpo en el contexto de la tasa de activación (ka) y la tasa de desactivación (kd). El eje y representa la tasa de activación (ka), en la que el anticuerpo se une al antígeno. El valor ka depende de la concentración de antígeno (M) y del tiempo (segundos). El eje x representa la tasa de desactivación (kd), en la que el anticuerpo se disocia del antígeno. El valor de kd depende del tiempo (segundos). La KD es una relación de kd/ka y representa la afinidad aparente en molaridad; como tal, un valor de KD más pequeño representa una mayor afinidad. La ubicación de los puntos rojos representa la ka y la kd de cada anticuerpo. Los puntos rojos se agrupan en sus respectivos intervalos de KD.
Cinética de anticuerpos de alta resolución y caracterización de epítopos
La tecnología de resonancia de plasmón de superficie (SPR) es un soporte para medir la cinética de unión anticuerpo-antígeno, clasificación de la afinidad y determinación del reconocimiento de epítopos.
Nuestra innovadora tecnología SPR de alto rendimiento, basada en varias plataformas Carterra LSA, permite el cribado de miles de afinidades de anticuerpos y el agrupamiento de hasta 192 x 192 interacciones para la afinidad precisa y el análisis de unión de epítopos. Junto con la síntesis de genes de genes clonales, la plataforma de expresión automatizada, la capacidad de desarrollo y la caracterización funcional, Twist Biopharma Solutions puede generar un paquete de datos que le permite identificar y tomar las decisiones más informadas sobre candidatos terapéuticos.
Clasificación de afinidad usada para seleccionar anticuerpos robustos y funcionales

La ilustración muestra la distribución de la afinidad del anticuerpo en el contexto de la tasa de activación (ka) y la tasa de desactivación (kd). El eje y representa la tasa de activación (ka), en la que el anticuerpo se une al antígeno. El valor ka depende de la concentración de antígeno (M) y del tiempo (segundos). El eje x representa la tasa de desactivación (kd), en la que el anticuerpo se disocia del antígeno. El valor de kd depende del tiempo (segundos). La KD es una relación de kd/ka y representa la afinidad aparente en molaridad; como tal, un valor de KD más pequeño representa una mayor afinidad. La ubicación de los puntos rojos representa la ka y la kd de cada anticuerpo. Los puntos rojos se agrupan en sus respectivos intervalos de KD.
Clasificación de afinidad usada para seleccionar anticuerpos robustos y funcionales
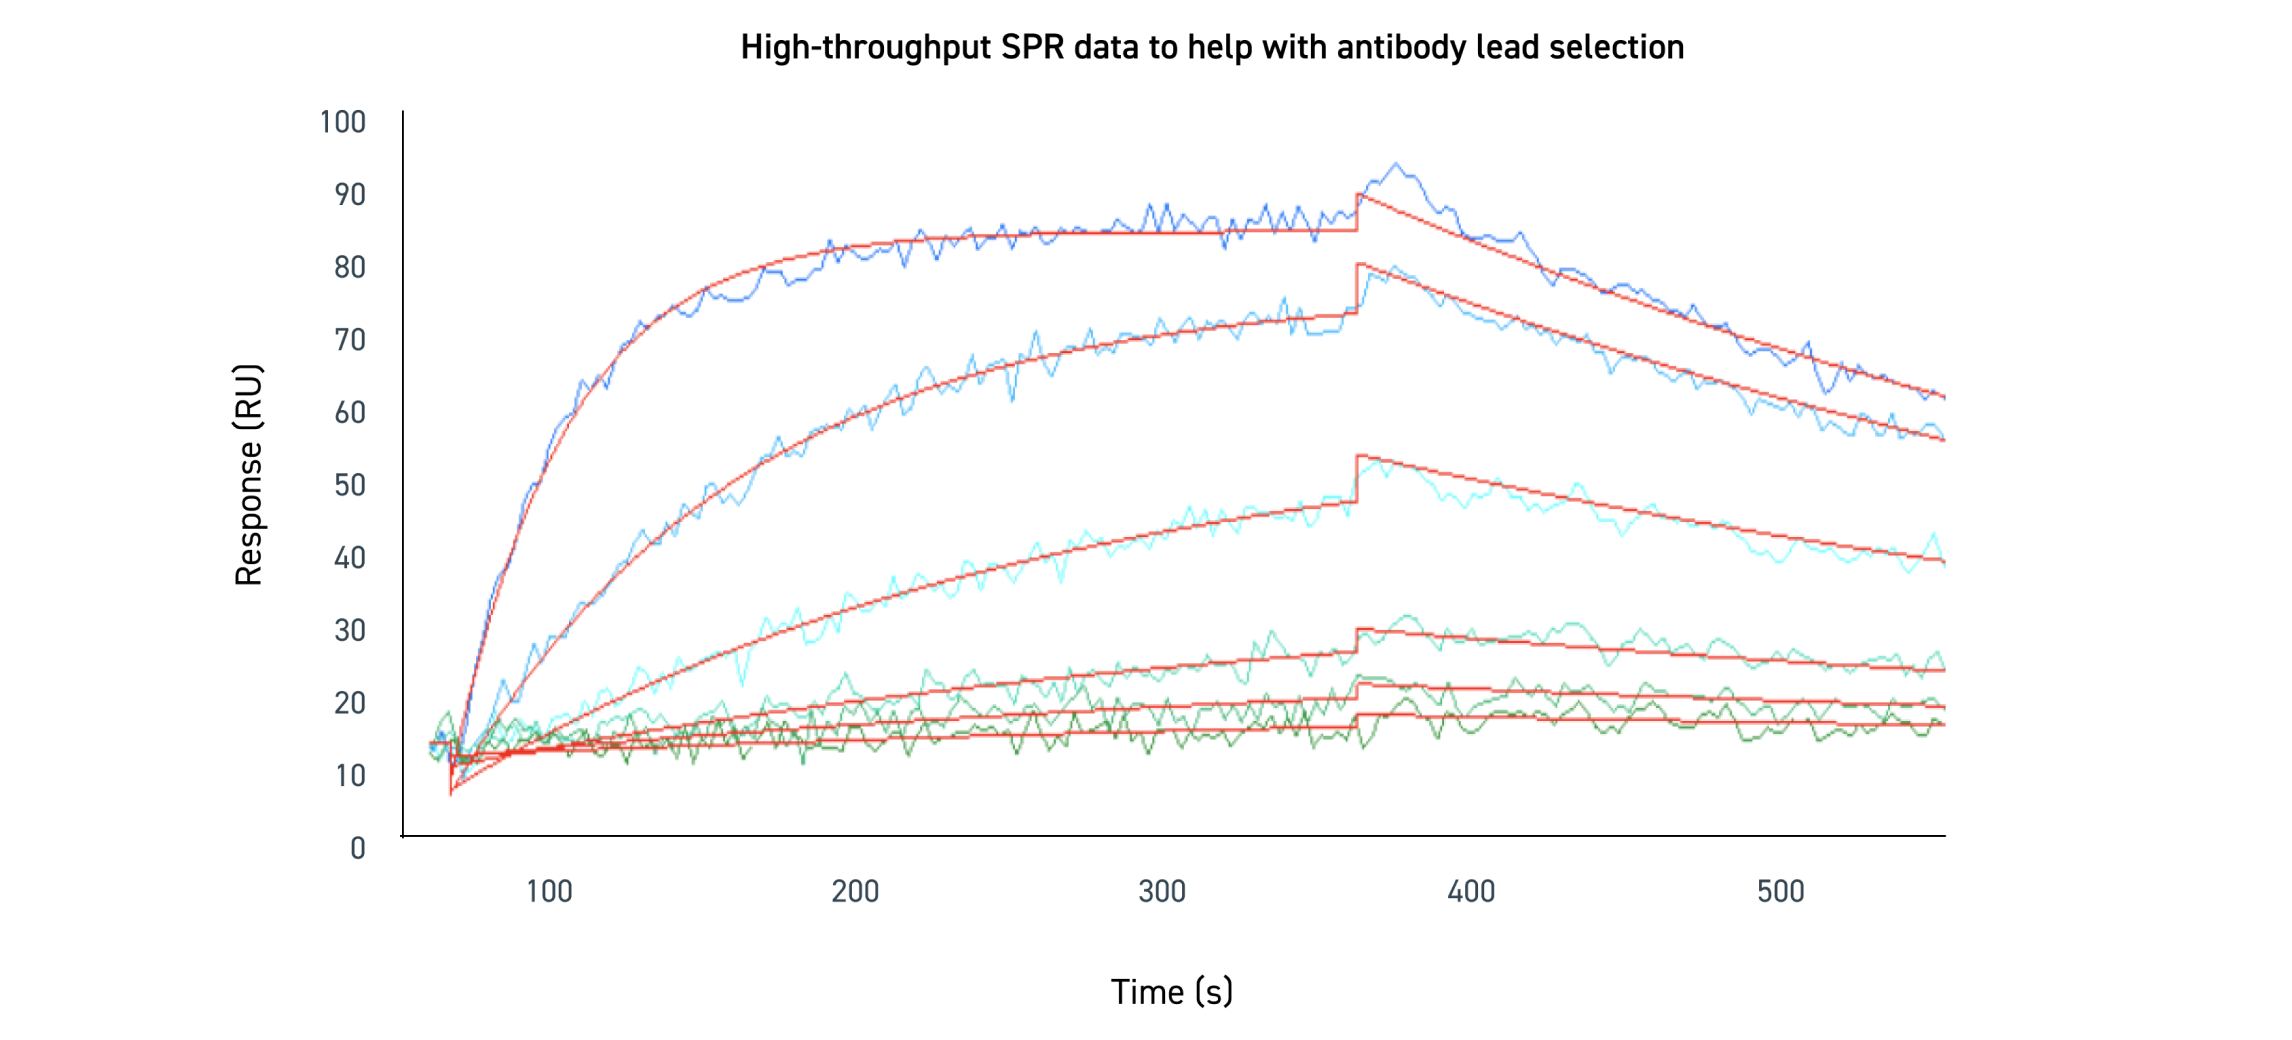
La unión se midió a diferentes concentraciones y se ajustó globalmente para estimar el valor de KD. Las líneas del sensorgrama tienen una tendencia ascendente durante la fase de asociación, en la que el anticuerpo se une al antígeno objetivo. Las líneas tienden a la baja durante la fase de disociación, ya que el anticuerpo acaba desprendiéndose del antígeno con el paso del tiempo. Los distintos tonos de líneas azules representan las distintas concentraciones de la proteína objetivo. Las líneas que muestran una mayor cantidad de unidades de resonancia (resonance units, RU) están asociadas a una mayor concentración de antígeno. Las líneas rojas representan el ajuste global de los datos.
Clasificación de afinidad usada para seleccionar anticuerpos robustos y funcionales

La unión se midió a diferentes concentraciones y se ajustó globalmente para estimar el valor de KD. Las líneas del sensorgrama tienen una tendencia ascendente durante la fase de asociación, en la que el anticuerpo se une al antígeno objetivo. Las líneas tienden a la baja durante la fase de disociación, ya que el anticuerpo acaba desprendiéndose del antígeno con el paso del tiempo. Los distintos tonos de líneas azules representan las distintas concentraciones de la proteína objetivo. Las líneas que muestran una mayor cantidad de unidades de resonancia (resonance units, RU) están asociadas a una mayor concentración de antígeno. Las líneas rojas representan el ajuste global de los datos.
Contacte con nosotros
Los entusiastas de los anticuerpos están a su disposición y estarían encantados de saber más sobre sus necesidades de descubrimiento. ¡Son bienvenidos los objetivos complejos!
