概述

High-Resolution Antibody Kinetics and Epitope Characterization

Surface plasmon resonance (SPR) technology is a mainstay for measuring antibody-antigen binding kinetics, affinity ranking, and determining epitope recognition.


Our cutting-edge, high-throughput SPR technology, powered by multiple Carterra LSA platforms, enables screening of thousands of antibody affinities and binning up to 192 x 192 interactions for precise affinity and epitope binding analysis. Coupled with our clonal gene synthesis, automated expression platform, developability, and functional characterization, Twist Biopharma Solutions can generate a data package that enables you to identify and make the most informed decisions about your therapeutic candidates.

亲和力排名——用于选择稳定的功能性抗体

亲和力

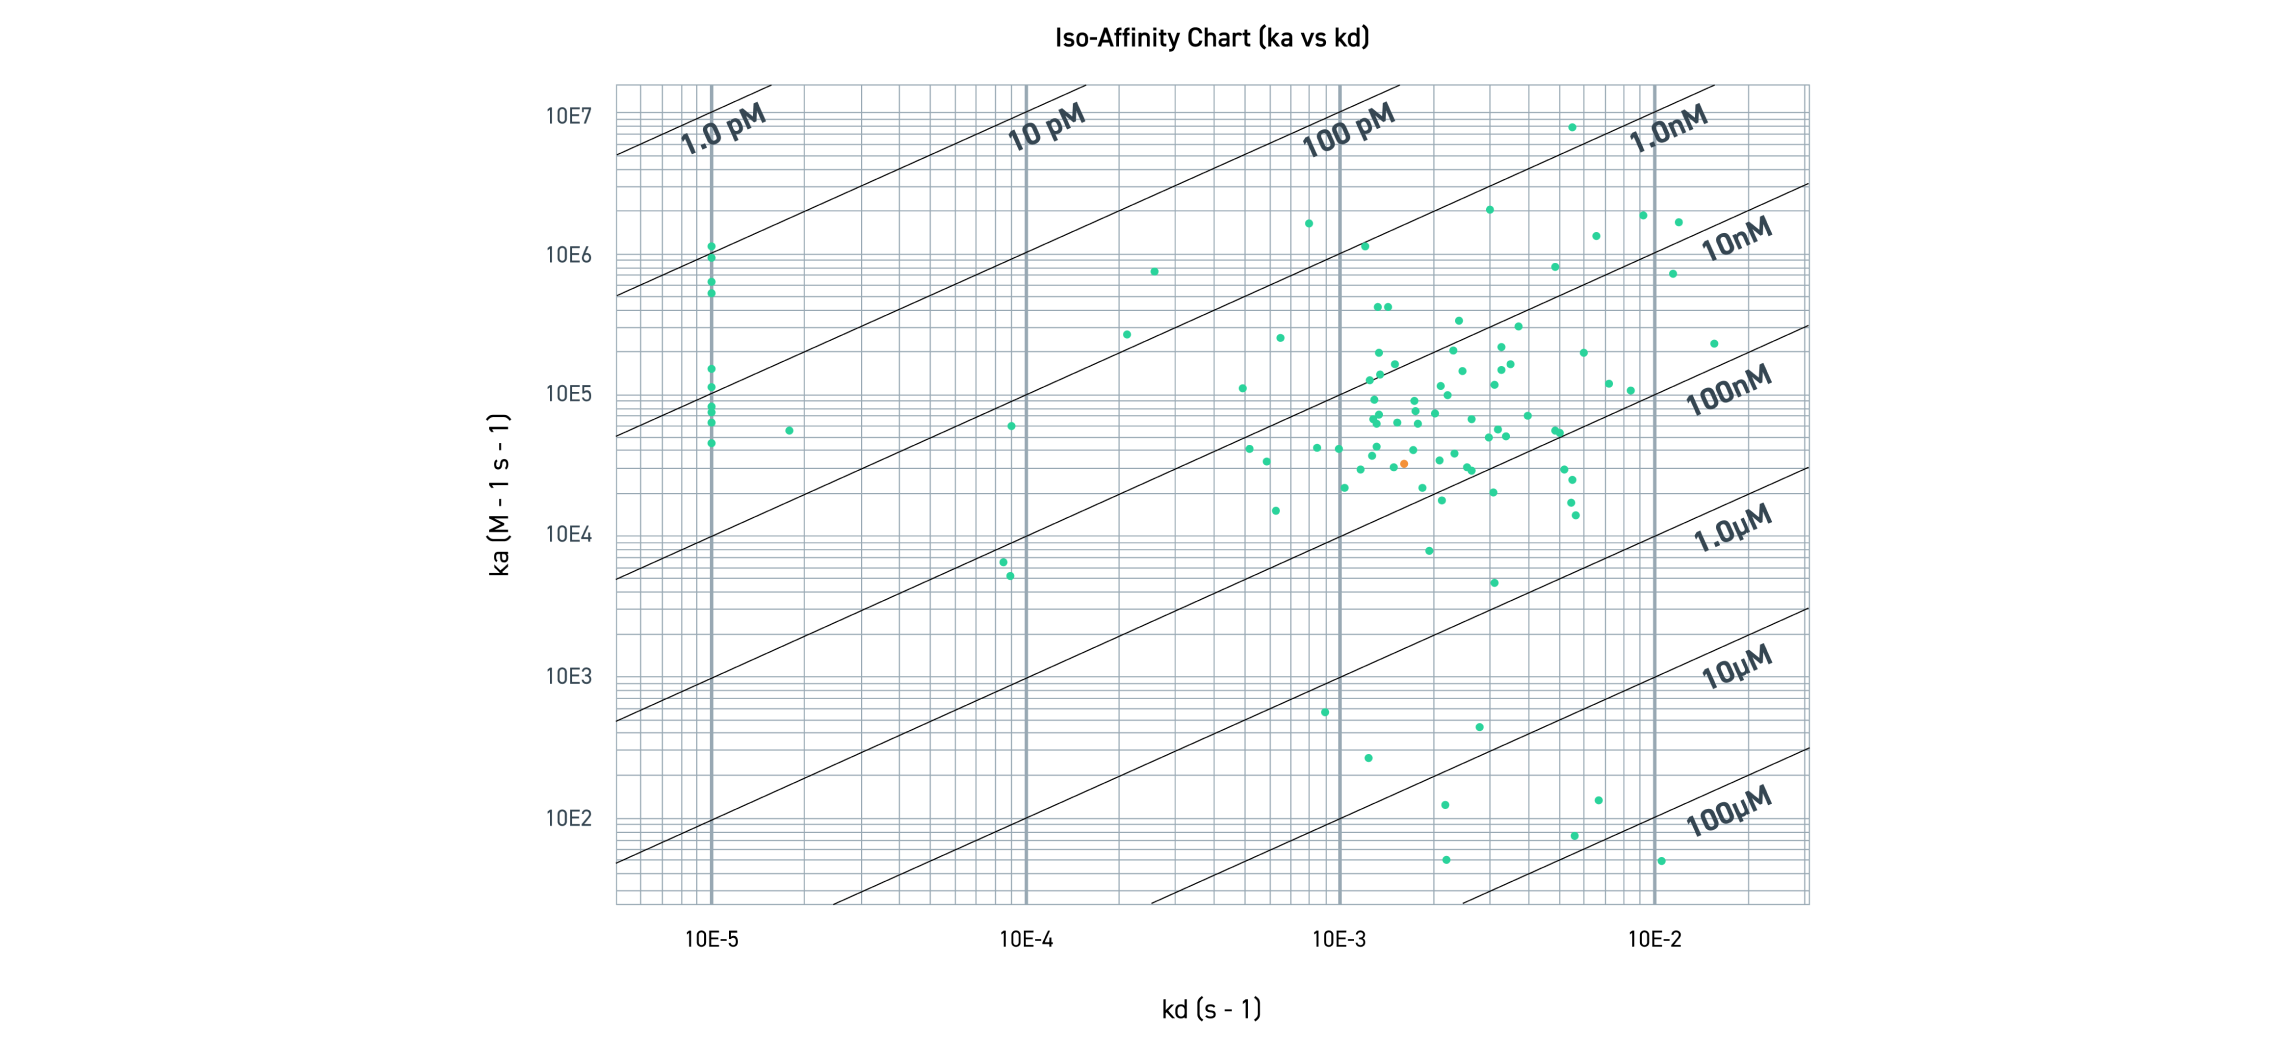
The figure shows the distribution of antibody affinity in the context of on-rate (ka) and off rate (kd). The y-axis represents the on-rate (ka), in which the antibody binds to the antigen. ka depends on antigen concentration (M) and time (seconds). x 轴代表抗体与抗原的解离率 (kd)。kd 取决于时间 (s)。KD is a ratio of kd/ka, representing apparent affinity in molarity — as such, a smaller KD value represents higher affinity. 红点的位置代表每种抗体的 ka 和 kd。The red dots are grouped into their respective KD ranges.

数据

亲和力排名——用于选择稳定的功能性抗体

affinity graph

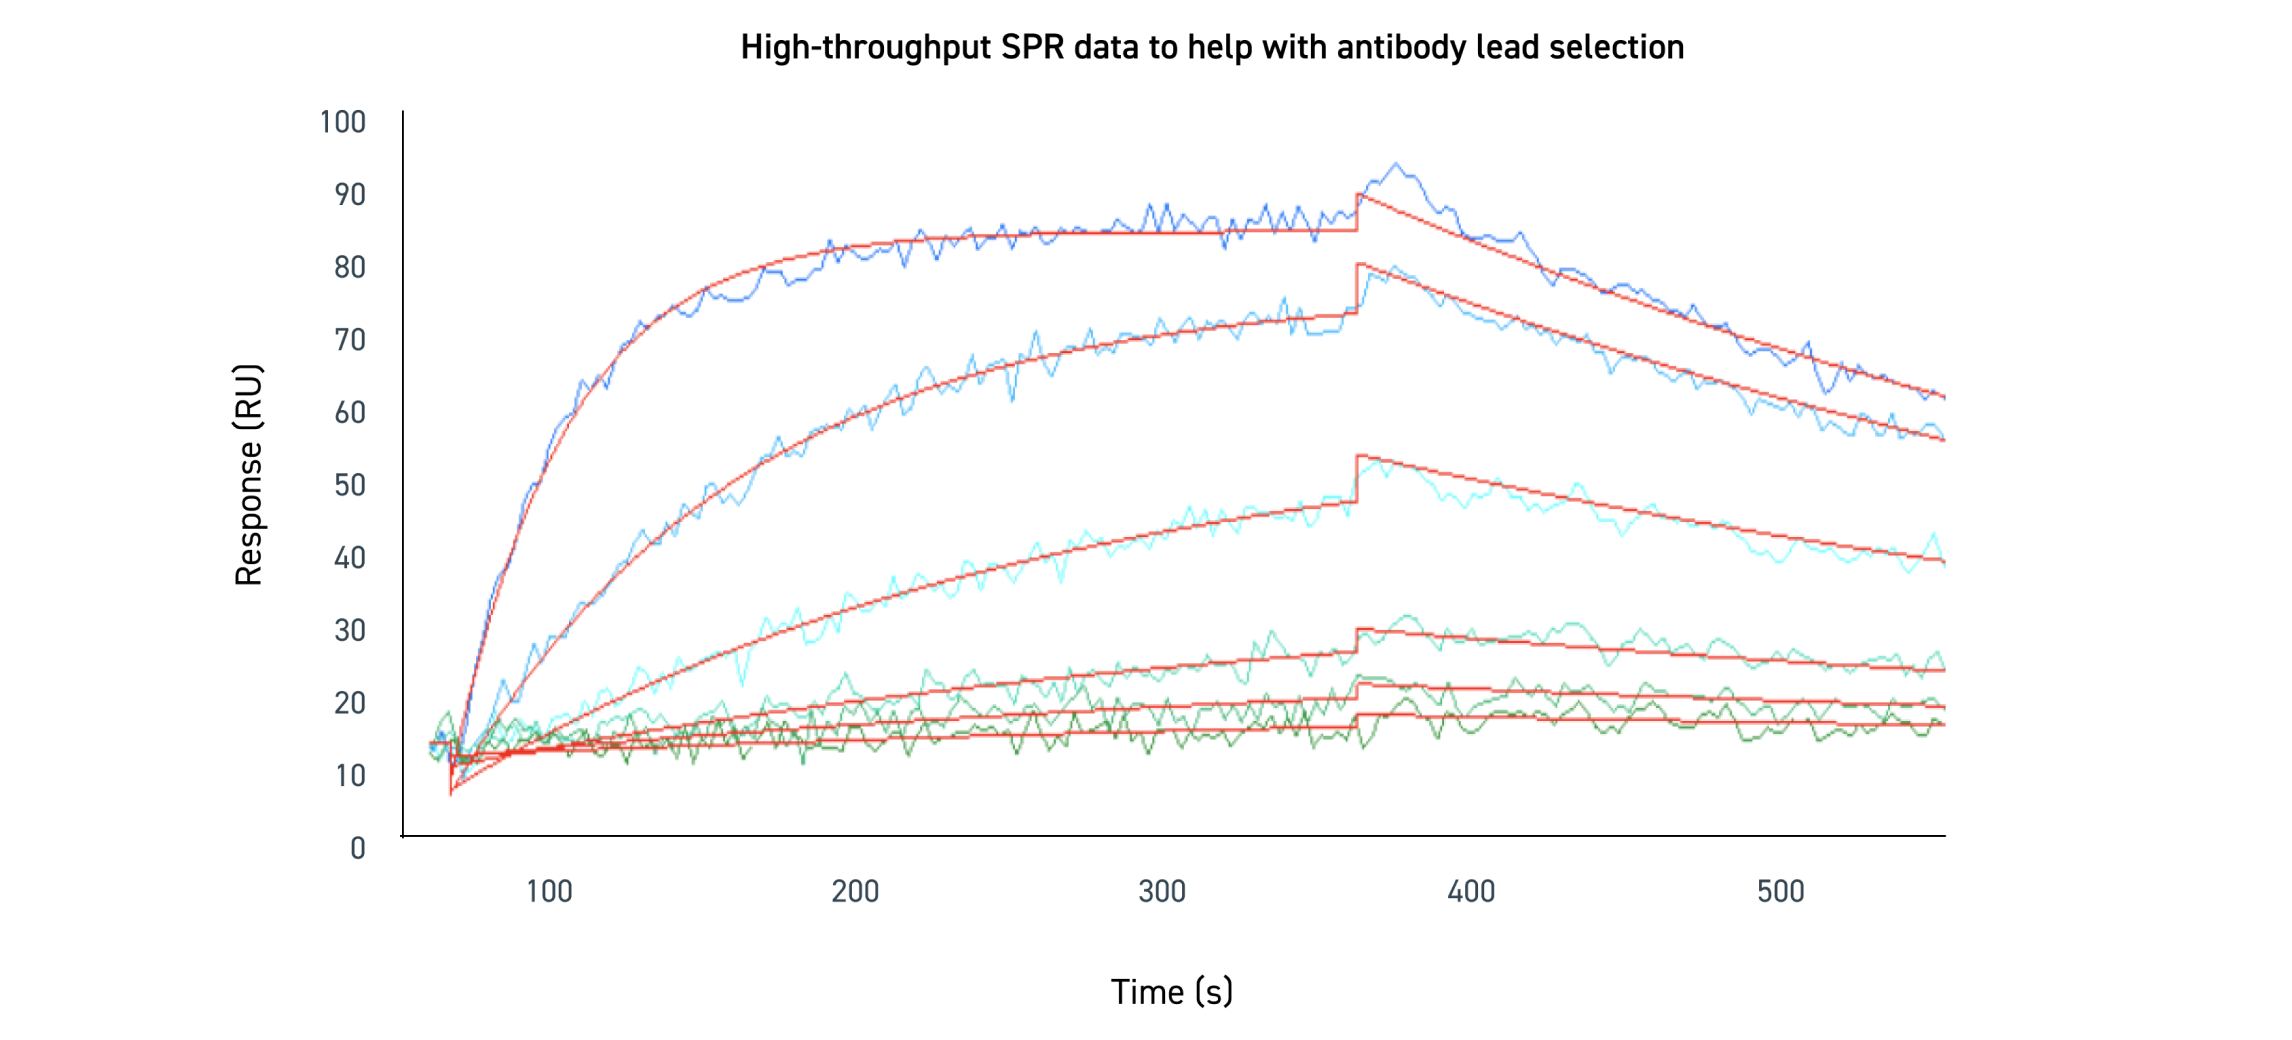
Binding was measured at various concentrations and globally fit to estimate the KD. 在抗体与靶向抗原结合的关联阶段,传感图上的线条呈上升趋势。在解离阶段中线条则呈下降趋势,因为随着时间的推移抗体最终会脱离抗原。不同深浅的蓝色线条代表不同浓度的靶标蛋白。显示较高 RU 的线条与较高的抗原浓度相关。红色线条代表数据的全局拟合。

亲和力排名——用于选择稳定的功能性抗体
affinity graph

Binding was measured at various concentrations and globally fit to estimate the KD. 在抗体与靶向抗原结合的关联阶段,传感图上的线条呈上升趋势。在解离阶段中线条则呈下降趋势,因为随着时间的推移抗体最终会脱离抗原。不同深浅的蓝色线条代表不同浓度的靶标蛋白。显示较高 RU 的线条与较高的抗原浓度相关。红色线条代表数据的全局拟合。

技术资源

技术资源

高通量抗体表征服务

Case StudiesBiopharma

Download the PDF

技术资源

高通量抗体表征服务

Case StudiesBiopharma

Download the PDF

联系我们

我们的抗体专家随时待命,并希望听到更多关于您的发现需求的信息。欢迎挑战性目标!
Powered by Translations.com GlobalLink Web Software