高解像度の抗体キネティクスとエピトープの特性評価
表面プラズモン共鳴(SPR)解析は、抗体と抗原の結合動態、親和性の順位付け、エピトープ認識部位を確認するために使用されます。
当社の最新ハイスループット SPR は、複数の Carterra LSA を用いて行われます。この技術によって数千の抗体の親和性スクリーニング、エピトープビニングを最大 192 x 192 の組み合わせで正確に行うことができます。。当社の Clonal Genes の合成、抗体発現プラットフォーム、開発要件評価、機能評価を組み合わせることで、Twist Biopharma Solutions は抗体医薬品候補の特定とお客様の意思決定を可能にするデータパッケージを提供します。
親和性の順位付けによる堅牢かつ機能的な抗体の選択
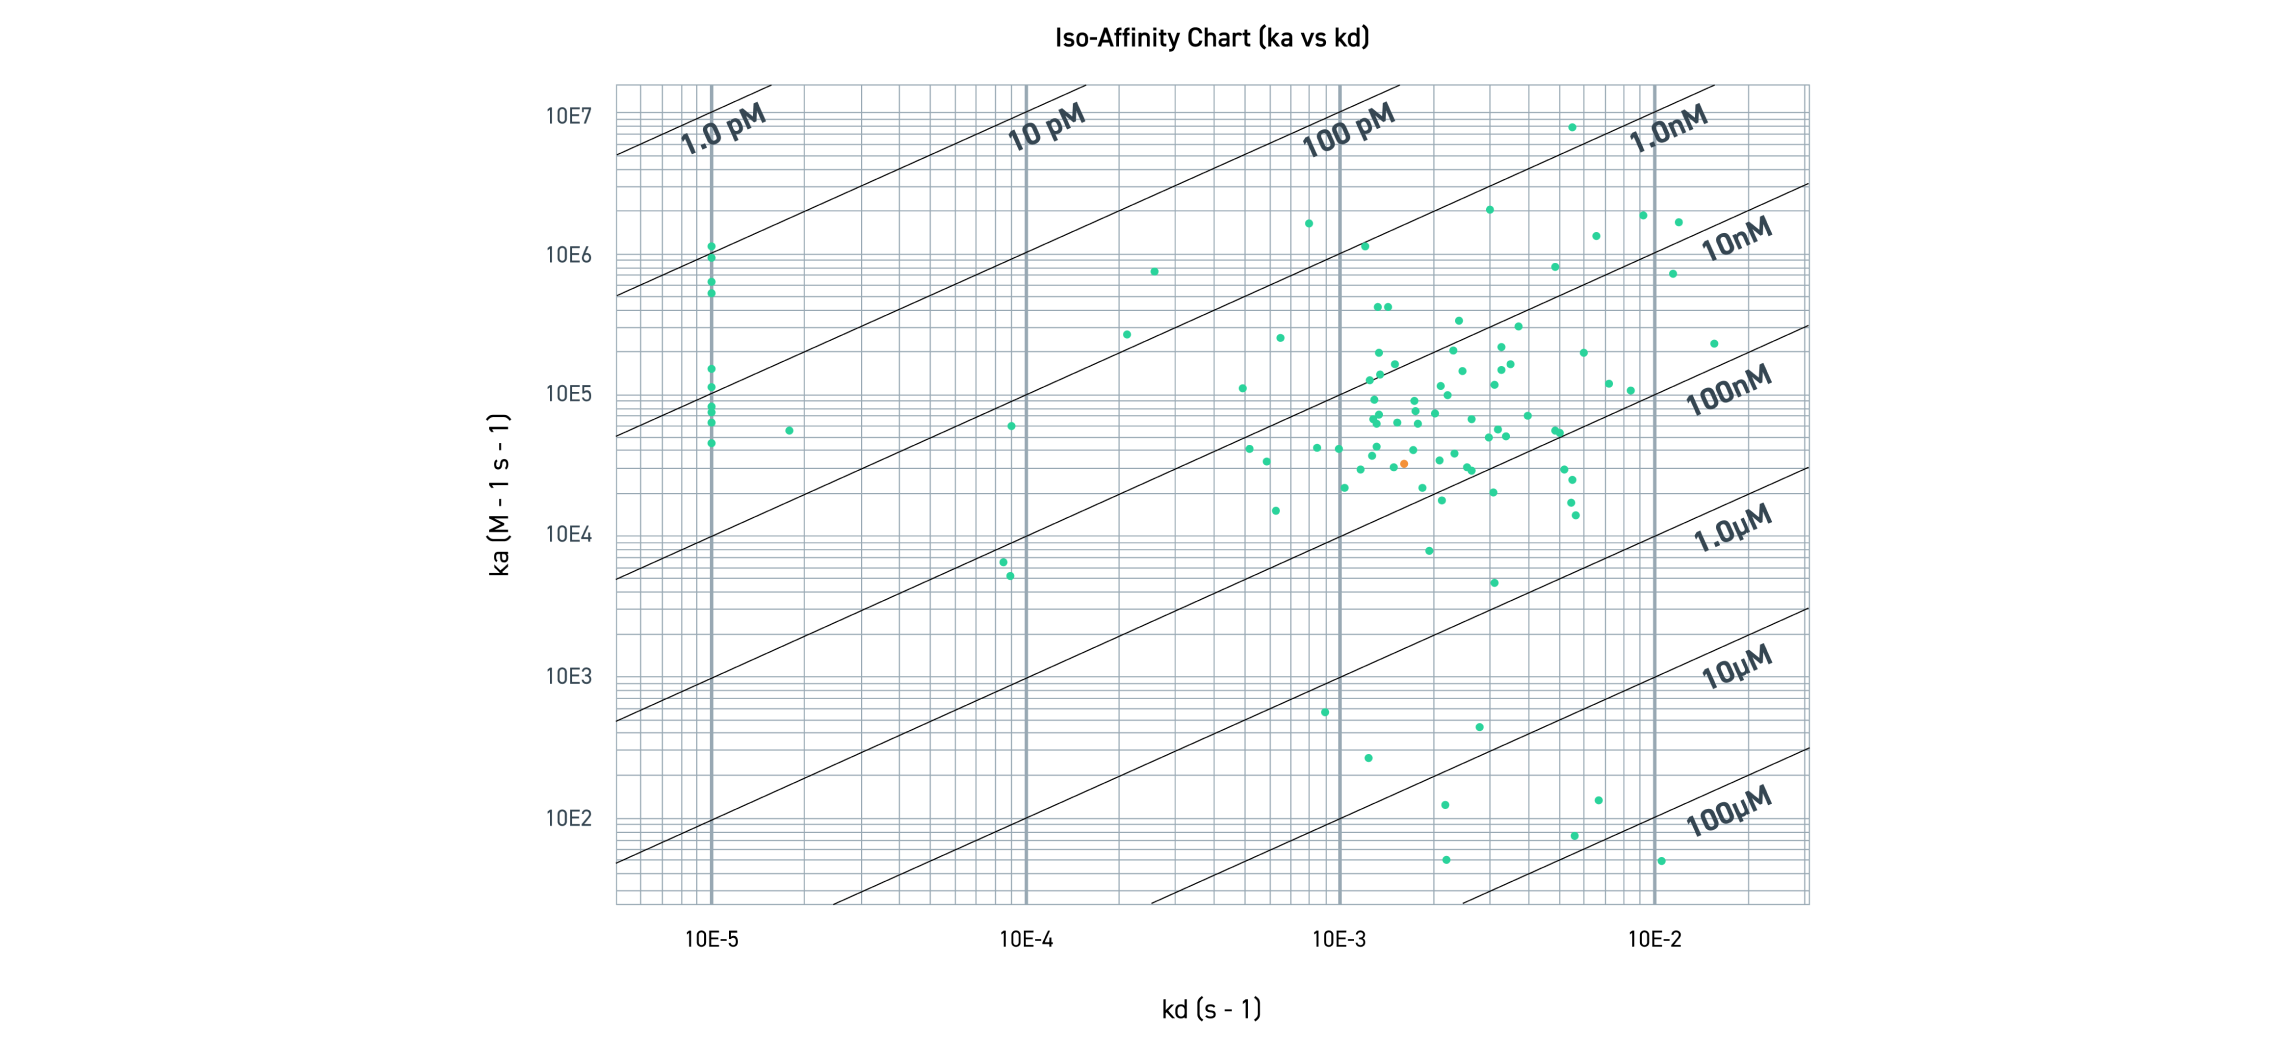
この図では on-rate(結合定数、ka)および off-rate(解離定数、kd)に着目して抗体の親和性を評価しています。y 軸は結合定数(ka)を示しており、抗体はその速度で抗原と結合します。ka は抗原濃度(M)と時間(秒)に依存します。x 軸は解離定数(kd)を示しており、抗体はその速度で抗原から解離します。kd は時間(秒)に依存します。KD は kd/ka 比で、モル濃度で示される見かけの親和性を表します。このため、KD 値が小さいほど親和性が高いことを示します。点の位置は、各抗体の ka と kd を示しています。点は、それぞれの KD 範囲にグループ化されます。
高解像度の抗体キネティクスとエピトープの特性評価
表面プラズモン共鳴(SPR)解析は、抗体と抗原の結合動態、親和性の順位付け、エピトープ認識部位を確認するために使用されます。
当社の最新ハイスループット SPR は、複数の Carterra LSA を用いて行われます。この技術によって数千の抗体の親和性スクリーニング、エピトープビニングを最大 192 x 192 の組み合わせで正確に行うことができます。。当社の Clonal Genes の合成、抗体発現プラットフォーム、開発要件評価、機能評価を組み合わせることで、Twist Biopharma Solutions は抗体医薬品候補の特定とお客様の意思決定を可能にするデータパッケージを提供します。
親和性の順位付けによる堅牢かつ機能的な抗体の選択

この図では on-rate(結合定数、ka)および off-rate(解離定数、kd)に着目して抗体の親和性を評価しています。y 軸は結合定数(ka)を示しており、抗体はその速度で抗原と結合します。ka は抗原濃度(M)と時間(秒)に依存します。x 軸は解離定数(kd)を示しており、抗体はその速度で抗原から解離します。kd は時間(秒)に依存します。KD は kd/ka 比で、モル濃度で示される見かけの親和性を表します。このため、KD 値が小さいほど親和性が高いことを示します。点の位置は、各抗体の ka と kd を示しています。点は、それぞれの KD 範囲にグループ化されます。
親和性の順位付けによる堅牢かつ機能的な抗体の選択
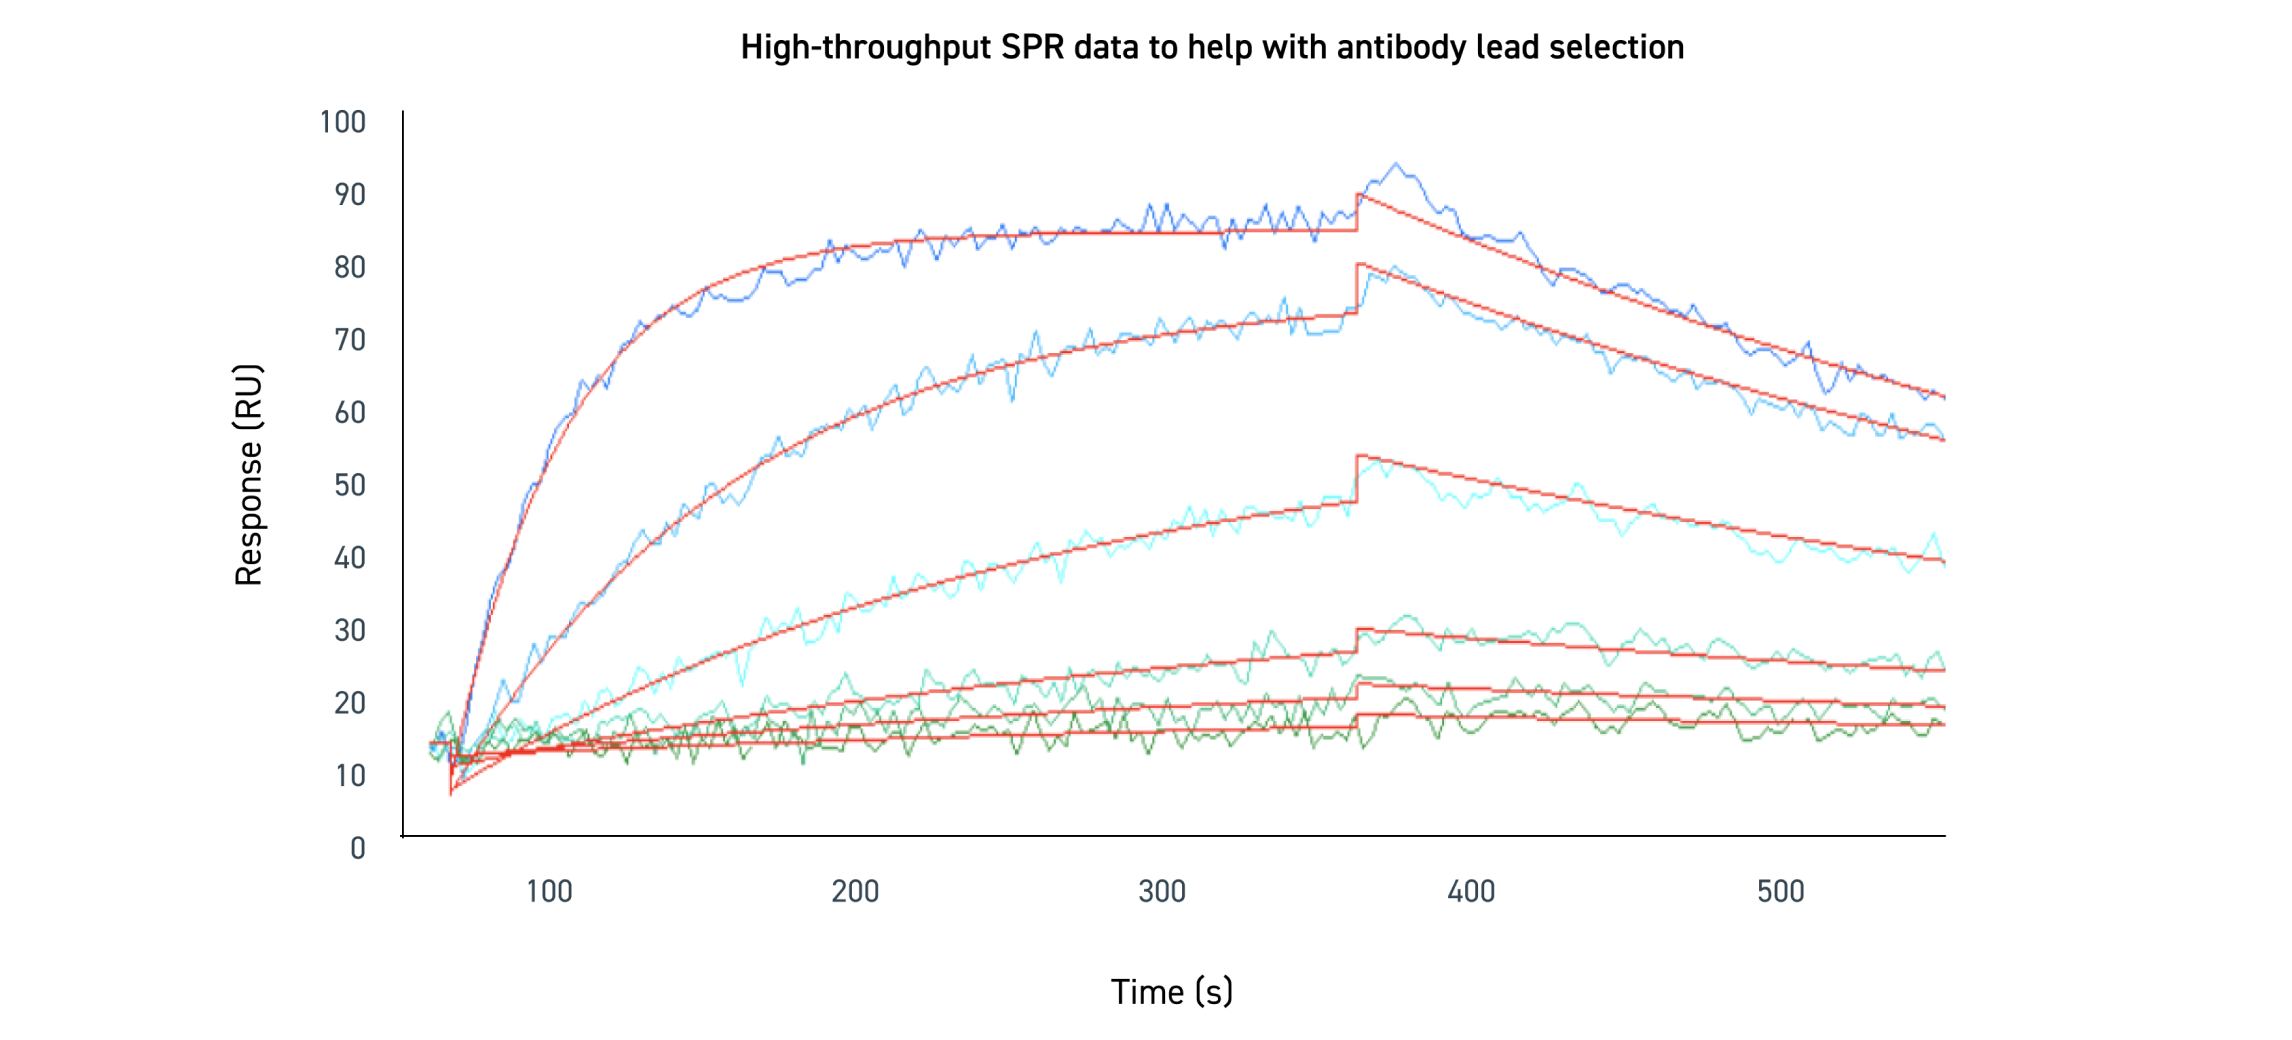
各濃度で測定した結果を使ってグローバルフィッティングを行い、 KD を見積もりました。抗体が標的抗原に結合する段階ではセンサーグラムの線は上向きになります。解離する段階では、時間の経過と共に抗体が抗原から離れるため、センサーグラムの線は下向きになります。標的タンパクの濃度を振って測定した結果を青から緑の線で表しています。高い反応(RU 値)を示す線は、高い抗原濃度のデータであり、RU値と抗体濃度の相関が見られます。赤線は、データを解析して得られたフィッティングカーブを示します。
親和性の順位付けによる堅牢かつ機能的な抗体の選択

各濃度で測定した結果を使ってグローバルフィッティングを行い、 KD を見積もりました。抗体が標的抗原に結合する段階ではセンサーグラムの線は上向きになります。解離する段階では、時間の経過と共に抗体が抗原から離れるため、センサーグラムの線は下向きになります。標的タンパクの濃度を振って測定した結果を青から緑の線で表しています。高い反応(RU 値)を示す線は、高い抗原濃度のデータであり、RU値と抗体濃度の相関が見られます。赤線は、データを解析して得られたフィッティングカーブを示します。
技術資料
技術資料
お問い合わせフォーム
抗体の専門家がお客様の開発ニーズについて詳しくお伺いいたします。難易度が高いと考えられる場合でもご遠慮なくお問い合わせください。
